Use case
Compare Employers' OSHA Safety Risk
Compare two or more employers' OSHA safety records side by side — risk score, repeat-offender flag, penalties, and violation trend for each.
You’re an EHS consultant benchmarking a client against its peers, or an analyst writing up a sector and you want the safety picture across the companies in it. The question is comparative: which of these employers’ OSHA records look worse, and is anyone’s trending the wrong way? OSHA has the underlying data for all of them, but it will only ever answer about one name at a time, and the answer it gives is a list of inspections — not something you can line up next to another list of inspections and read.
The manual way, and what it costs
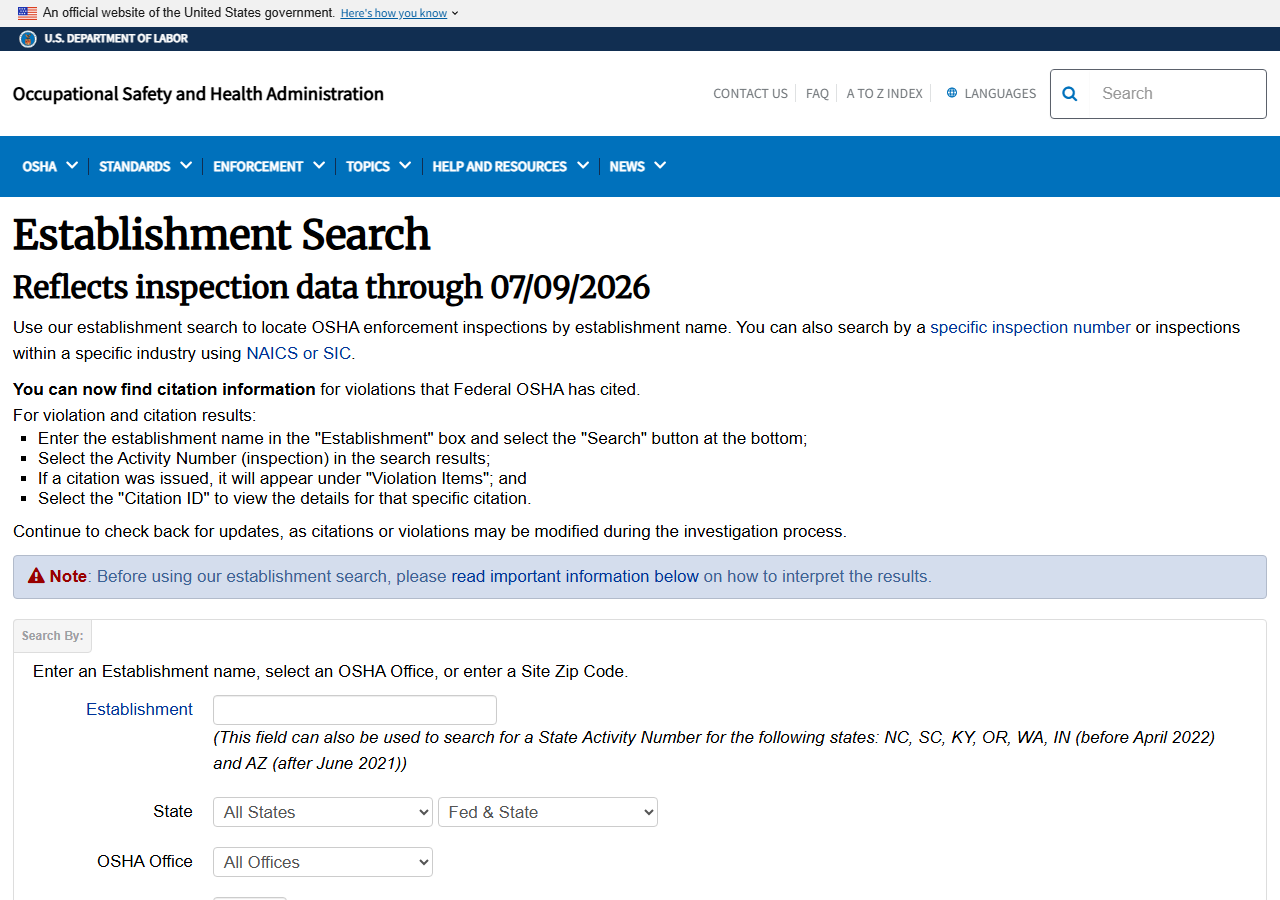
The IMIS establishment search is free and there is no trick to it: search the first company, open each inspection, note the citations and gravities, sum the penalties, repeat. Then do the second company. Then normalise the two by hand, because one of them has four times as many worksites as the other and four times the inspections to go with it, which tells you nothing on its own.
For two companies with short records this is an afternoon and it’s perfectly reasonable — the free portal is the primary source and you should be using it either way. It falls over on the third axis: doing it again. A benchmark you re-run every quarter, over six or ten employers, is where hand-collection turns into a standing chore with no export to show for it.
The faster way
OSHA Violation Risk & Time-Series does the same search once and hands back every row at once.
{
  "employers": [
    "Dollar General",
    "Dollar Tree"
  ],
  "maxInspectionsPerEmployer": 25
}
Two names, one run, one row each — add as many as you want to the array. The important bit is that
maxInspectionsPerEmployer is the same for every employer in the run, and it has to be: the
score, the totals and the time-series are computed over whatever inspections were pulled, so
comparing a company capped at 25 against one capped at 200 compares two different questions. Keep
the cap constant, and keep state constant too — either compare everyone nationwide or compare
everyone within the same state.
What comes back
{
  "query": "Dollar General",
  "state": null,
  "establishments": [
    "Dollar General Store 12345"
  ],
  "inspection_count": 2,
  "violation_count": 2,
  "by_gravity": {
    "serious": 2
  },
  "total_current_penalty": 14000,
  "total_initial_penalty": 14000,
  "risk_score": 21,
  "risk_band": "medium",
  "repeat_offender": false,
  "trend": "falling",
  "violation_time_series": [
    {
      "year": 2024,
      "violations": 2,
      "penalty": 14000
    }
  ],
  "first_seen": false,
  "new_inspections": 0,
  "new_violations": 0,
  "risk_score_delta": 0,
  "source_url": "https://www.osha.gov/ords/imis/establishment.search?establishment=Dollar+General&state=all"
}| Field | Example value | Meaning |
|---|---|---|
query | Dollar General | The employer name you searched |
risk_score | 21 | Deterministic 0-100 severity-weighted, recency-decayed risk score |
risk_band | medium | low / medium / high |
repeat_offender | False | True if any Repeat-gravity violations |
trend | falling | rising / flat / falling (recent vs prior 2-year windows) |
by_gravity | {"serious": 2} | Violation counts by OSHA gravity (willful/repeat/serious/other) |
One row like that per employer, with the same columns in the same order — which is the whole point;
the values above are an illustration of the structure, not a figure for any named company. Sort the
rows on risk_score and you have a ranking. by_gravity is what’s underneath it: how many
citations OSHA classified Willful, Repeat, Serious or Other. trend is the direction of travel,
comparing gravity-weighted violations in the last two years against the two before them —
rising above 1.2×, falling below 0.8×, flat in between — and violation_time_series is the
year-by-year series you’d chart it from. An employer with a middling score and a rising trend is a
different story from one with the same score and a falling one.
Be honest about the ranking, though. risk_score is our deterministic arithmetic over OSHA’s
public record — gravity-weighted (Willful 10, Failure to Abate 8, Repeat 6, Serious 3, Other 1),
decayed by age, scaled onto 0–100 with a saturating curve. OSHA does not publish an employer score
and this is not one; it doesn’t imply anything about OSHA’s view of any company. It’s reproducible
and the formula is in the how-to, so anyone you show the
ranking to can rederive it — which is the only reason a derived score belongs in a benchmark at all.
What you’d do with it
Export to CSV and you have the benchmark table: one line per employer, risk_score, risk_band,
repeat_offender, by_gravity and total_current_penalty across the columns, inspections[]
underneath as the audit trail with a source_url on every inspection. Chart
violation_time_series per employer and the comparison becomes a slide. Then schedule the run with
compareToPrevious on: from the second run, each row also carries new_inspections,
new_violations and risk_score_delta, so the quarterly refresh is a diff rather than a redo.
Worth knowing
The comparison is only as fair as the records behind it, and the records aren’t fair. Inspections
are not evenly distributed: an employer with hundreds of worksites accumulates inspections and
citations that a single-site employer never could, so raw counts — and a score built on raw counts
— run high for big companies for reasons that have nothing to do with how safe they are. Compare
like with like, or don’t compare. Beyond that: this covers OSHA federal and state-plan inspection
data as exposed in the public IMIS establishment search, which can lag and only reflects workplaces
that were inspected; an inspection is not a finding of guilt, and citations can be contested and
reduced. Establishment names in OSHA’s data are per-inspection and inconsistent, so each report
aggregates whatever matched the name you searched — read the establishments array to see what got
folded in, and use the state filter to narrow. The score reflects recorded violations only, not
unreported hazards. It’s a relative signal, not a regulatory determination.
Run it yourself: How to run OSHA Violation Risk & Time-Series walks the whole thing step by step.
Screening a list rather than ranking one?
Screen a Supplier for OSHA Repeat Violations
uses the same report as a pass/fail filter on repeat_offender. And if the employers you’re
benchmarking are contractors,
California Contractor Directory is where you’d get the
licence, bond and workers’-comp status to sit next to the safety record.
Last updated 2026-07-13