Use case
Google Maps rank grid: coffee shop around a café in Oakland
Where a café ranks on Google Maps for 'coffee shop' across a 5x5 grid 1 km apart in Oakland, CA, with every competitor's rank and a heatmap.
Say you run a small local-SEO agency in the East Bay and you are pitching independent cafés in downtown Oakland. Your opening slide needs to show a café owner something they have not seen: not “you rank 6th”, which is true only where they stand, but where they rank across the neighbourhood and who takes the customers they lose. To show what that slide looks like, we ran the Google Maps Geo-Grid Rank Tracker on a well-known café, Blue Bottle Coffee at 480 9th St, for “coffee shop” on 2026-11-06. Blue Bottle is only the worked example here, not a client. (New to the actor? The step-by-step guide covers every input.)
The manual way, and what it costs
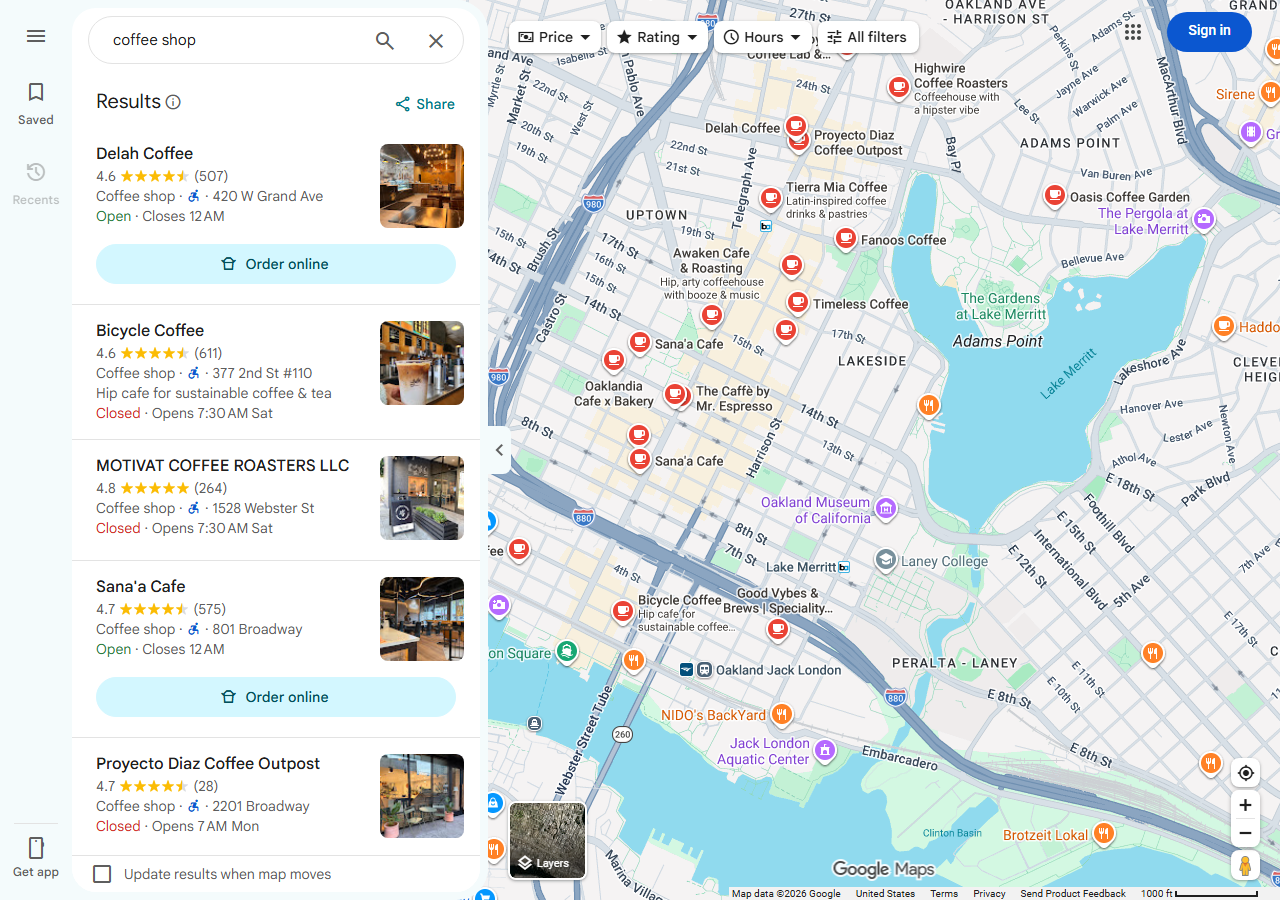
You can do this by hand. Open Google Maps, drag the map to a spot, search “coffee shop”, and count down the list until you reach the café; Google Maps shows 20 places per page, so a café ranked 46th is on the third page. Write down the rank and the names above it, then move the map 1 km and do it again. A 5x5 grid is 25 searches, and none of it exports, so the ranks and rival names go into a sheet by hand. For a single check from the café’s own door, Google Maps is the right tool and costs nothing. It stops being reasonable when you want the same 25 points next month, or the same grid for 3 keywords, and need the numbers to line up.
The faster way
Google Maps Geo-Grid Rank Tracker & Competitor Heatmap does the same search once and hands back every row at once.
{
  "businesses": [
    "Blue Bottle Coffee 480 9th St Oakland"
  ],
  "keywords": [
    "coffee shop"
  ],
  "gridSize": 5,
  "stepKm": 1,
  "zoomMeters": 3000
}
A 5x5 grid 1 km apart covers 4 km by 4 km around the café. The listing suggests 1 km for a city neighbourhood and 3 to 5 km for a suburb, and downtown Oakland is the first case. The 3,000 m view is the default and about a neighbourhood on a phone screen. Keep it fixed: at the centre point the same café ranked 2nd with a 1,000 m view and 33rd with a 30,000 m view, so changing the zoom between two runs changes the answer more than anything the café did.
What comes back
{
  "row_type": "summary",
  "business": "Blue Bottle Coffee",
  "business_place_id": "ChIJLRIbILeAj4ARyWoMWFQmkSY",
  "business_address": "480 9th St, Oakland, CA 94607",
  "keyword": "coffee shop",
  "grid_size": 5,
  "step_km": 1.0,
  "zoom_m": 3000,
  "points": 25,
  "points_ranked": 20,
  "average_rank": 35.95,
  "average_total_rank": 40.96,
  "top3_points": 0,
  "top10_points": 1,
  "top20_points": 5,
  "share_of_top3": 0.0,
  "rating": 4.4,
  "review_count": 396,
  "top3_average_reviews": 231.3,
  "rank_matrix": [
    [
      46,
      56,
      null,
      null,
      null
    ],
    [
      33,
      17,
      38,
      49,
      null
    ],
    [
      24,
      14,
      6,
      39,
      59
    ],
    [
      24,
      12,
      13,
      22,
      51
    ],
    [
      54,
      50,
      54,
      58,
      null
    ]
  ],
  "source_url": "https://www.google.com/maps/search/?api=1&query=Blue%20Bottle%20Coffee&query_place_id=ChIJLRIbILeAj4ARyWoMWFQmkSY"
}| Field | Example value | Meaning |
|---|---|---|
row_type | summary | point (one grid point, charged), summary or competitor (free) |
business | Blue Bottle Coffee | The tracked business as Google Maps names it (empty in market mode) |
business_place_id | ChIJLRIbILeAj4ARyWoMWFQmkSY | Google’s place ID for the tracked business |
keyword | coffee shop | The search typed at each point |
grid_row | — | Point rows: 0 is the northernmost row |
grid_col | — | Point rows: 0 is the westernmost column |
rank_matrix is the slide. Read it north row first: the café ranks 6th at its own point in the
middle, and its best ground is just west and south of it (14 one point west, 12 and 13 in the row
below). East and north-east it fades: 39 and 59 on its own row, and not in the top 60 at all at 5
points, mostly in the north-east corner. Across the 25 points it was in the top 3 at 0, the top 10
at 1 and the top 20 at 5.
The competitor rows say who wins the points it loses. The run returned 86 of them, and three
cafés reached the top 3 at 5 points each: Sana’a Cafe (average rank 12.92, ranked at all 25
points), Kitsch Coffee (16.74, ranked at 23) and Proyecto Diaz Coffee (19.75, ranked at 16). The
summary’s top3_average_reviews is 231.3 against Blue Bottle’s 396 reviews, so in this grid the
cafés that beat it have fewer reviews on average, and the pitch has to be about something other than
review count.
What you’d do with it
Open the run’s key-value store and download the heatmap page for the café and keyword: green
squares for the top 3, light green for the top 10, yellow for the top 20, red beyond. That page
goes into the pitch deck as it is. Export the competitor rows to a sheet sorted by top3_points,
and the first few rows are the rivals to name. If the café signs, save the input as a task and run
the same grid, keyword and zoom each month; the change in average_total_rank (40.96 in this run)
is the number for the report, and the 25-point run costs $0.30 each time.
Worth knowing
These ranks are read from Google Maps itself, the maps search, not from the map pack on Google’s web search results. A rank is where the café appears in Google Maps’ answer for a map view centred on each point; it is not a search from a GPS-located phone. Results also vary by 1 to 4 places between internet connections: two connections reading this grid on 2026-11-06 disagreed by that much at the same points. So the numbers will not match another tool’s to the place, and the useful comparison is this grid against itself next month. The business is found by searching its name and address, and every row names the place it resolved to; check that on the first run. The actor was built and tested on US businesses.
Run it yourself: How to run Google Maps Geo-Grid Rank Tracker & Competitor Heatmap walks the whole thing step by step.
To build the list of cafés to pitch in the first place, with a phone number for each, the Restaurant, Cafe & Bar Scraper searches a city’s Google Maps listings ZIP code by ZIP code.
Last updated 2026-11-06