How-to
How to run Google Maps Geo-Grid Rank Tracker & Competitor Heatmap
Step-by-step: the exact input, what each field does, and the rows that come back from Google Maps.
You look after a local business on Google Maps, your own or a client’s, and you want to know where it ranks for the words its customers type. One check from your desk answers that for your desk only: rankings change block by block, and a customer two kilometres away sees a different list. The manual route is to move the map to each spot, search the keyword, and scroll until you find the business, writing down its rank and who sits above it. A 5x5 grid is 25 of those searches per keyword, and a business below rank 20 means paging through Google’s results 20 places at a time. This actor runs every point of the grid in one go and returns the business’s rank at each one, plus every competitor’s.
What you’ll need
Nothing but an Apify account. The actor talks to Google Maps directly.
There is no API key and no Google account to connect, and you do not need to own the business you track. Searches go through Apify Proxy, which Apify bills as ordinary platform usage on your plan, like compute.
Step 1 — Open the actor
Open Google Maps Geo-Grid Rank Tracker & Competitor Heatmap on the Apify Store and press Try for free. The actor’s own page on this site lists its live health and pricing.
Step 2 — Fill in the input
| Field | Type | Required | What it does |
|---|---|---|---|
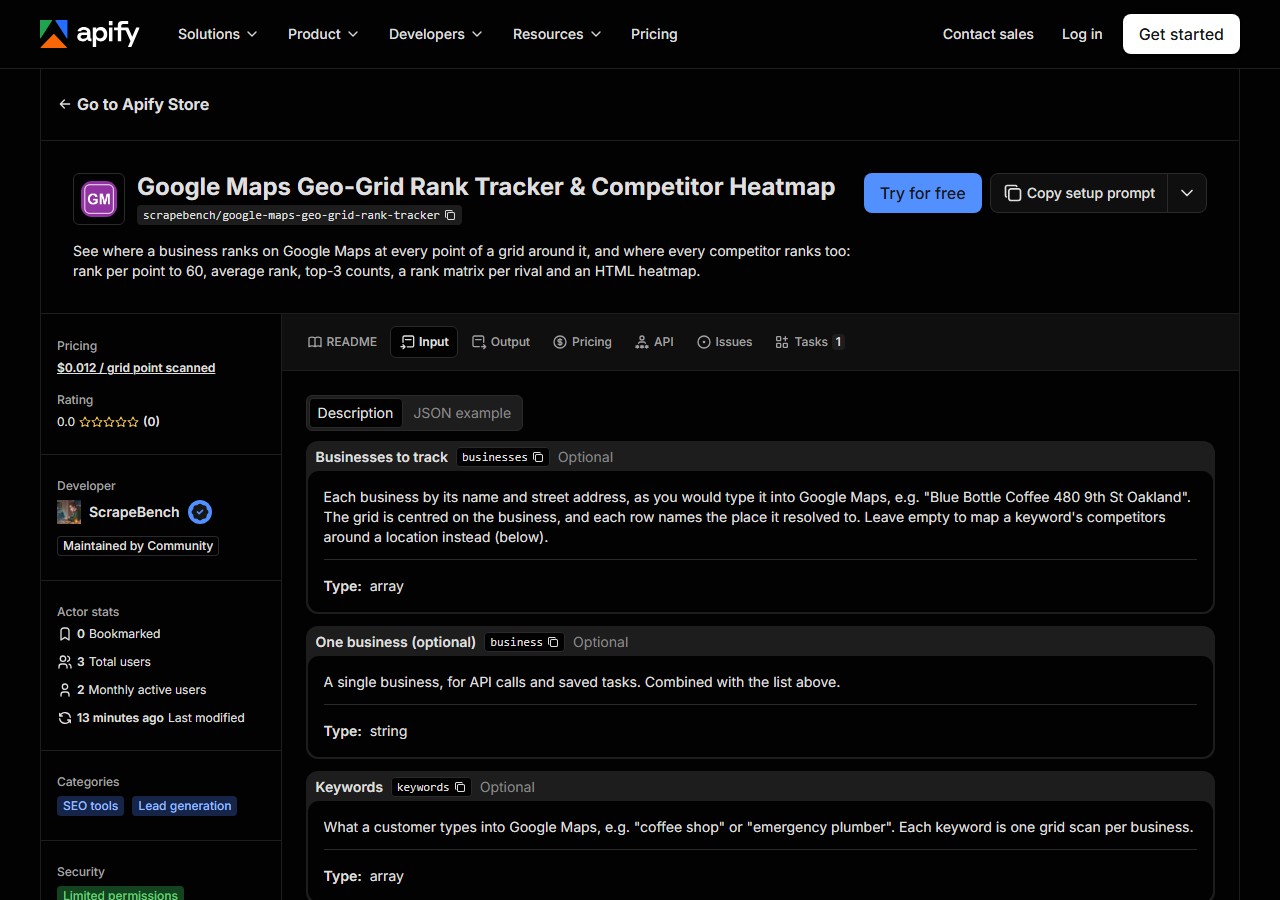
businesses | array | no | Each business by its name and street address, as you would type it into Google Maps, e.g. “Blue Bottle Coffee 480 9th St Oakland”. The grid is centred on the business, and each… |
business | string | no | A single business, for API calls and saved tasks. Combined with the list above. |
keywords | array | no | What a customer types into Google Maps, e.g. “coffee shop” or “emergency plumber”. Each keyword is one grid scan per business. |
keyword | string | no | A single keyword, for API calls and saved tasks. Combined with the list above. |
gridSize | integer | no | Points per side: 3, 5, 7 or 9 (3 = 9 points, 5 = 25, 7 = 49, 9 = 81). Any other number is rounded to the nearest of these. Each point is one charge per keyword. (default 5) |
stepKm | number | no | Kilometres between neighbouring grid points. 1 km suits a city neighbourhood; 3-5 km a suburb or a service-area business. (default 1) |
zoomMeters | integer | no | How wide the Google Maps view is at each point, which is the map’s zoom. It changes rankings a lot (in our test one business ranked 2nd with a 1,000 m view and 33rd with a… (default 3000) |
maxRank | integer | no | Look for the business down to this rank: 20, 40 or 60 (Google Maps pages hold 20 places). Included in the price per point. Beyond it the point reads “not ranked”. (default 60) |
includeCompetitorMatrix | boolean | no | Adds a free row for every competitor that reaches the top 10 at any point: its rank at every point, average rank, top-3 count, rating and reviews. (default True) |
location | string | no | With no business above, the grid is centred here and you get the competitor rows only, e.g. “Downtown Oakland, CA”. |
centerLatitude | number | no | With no business, centre the grid on these coordinates instead of a location name. |
centerLongitude | number | no | Pairs with the centre latitude. |
maxGridPoints | integer | no | Optional spend cap for the WHOLE run (all businesses and keywords together): scanning stops at this many points and a free row says how many were left. |
The field that surprises people is zoomMeters, the width of the Google Maps view searched at each
point. Google Maps ranks the places inside the visible map, so a wider view brings in more rivals.
In our test on 2026-11-06, Blue Bottle Coffee in Oakland ranked 2nd for “coffee shop” with a
1,000 m view, 6th at 3,000 m, 16th at 10,000 m and 33rd at 30,000 m, all from the same spot. No
zoom is the right one; pick one and keep it for every run you plan to compare. The default, 3,000 m,
is about a neighbourhood on a phone screen.
gridSize and stepKm set the area together: a 5x5 grid 1 km apart covers 4 km by 4 km around the
business. Use 1 km for a city neighbourhood and 3 to 5 km for a suburb or a service-area business.
Every point is charged once per keyword, so 2 keywords on a 7x7 grid is 98 points. Give each
business by its name and street address, as you would type it into Google Maps; the actor resolves
it to one place and names that place on every row, so check it on the first run.
A working input:
{
  "businesses": [
    "Blue Bottle Coffee 480 9th St Oakland"
  ],
  "keywords": [
    "coffee shop"
  ],
  "gridSize": 5,
  "stepKm": 1,
  "zoomMeters": 3000
}
Step 3 — Run it
Press Start. Rows are pushed to the dataset as they’re found, so the run log fills in as it works.
The example input above (a 5x5 grid for one keyword) scanned 25 points in 9.5 seconds on
2026-11-06; each point takes one to three Google Maps searches, five points at a time. You get 25
point rows, one summary row, and a competitor row for every place that reached the top 10 anywhere
on the grid, which was 86 rows in that run. A point where the business is not in the top 60 has an
empty rank; that happened at 5 of the 25 points in our test, and it means the business is not in
the ranks scanned there, not that the run failed. If every point is empty, open the summary and
check that business and business_address name the place you meant.
Step 4 — Read the output
Each run returns a labelled table, not raw JSON:
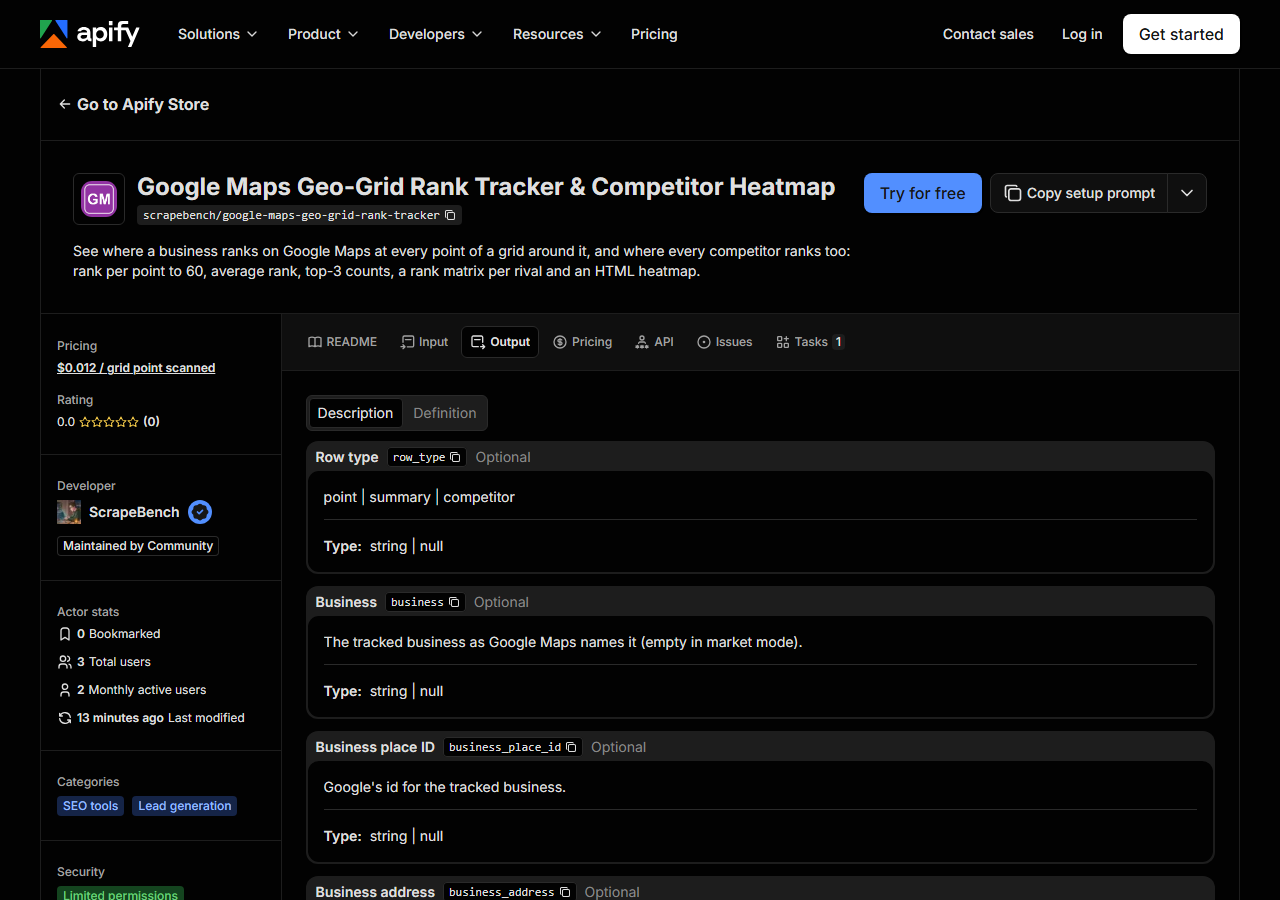
Every row looks like this — a real row from a real run:
{
  "row_type": "summary",
  "business": "Blue Bottle Coffee",
  "business_place_id": "ChIJLRIbILeAj4ARyWoMWFQmkSY",
  "business_address": "480 9th St, Oakland, CA 94607",
  "keyword": "coffee shop",
  "grid_size": 5,
  "step_km": 1.0,
  "zoom_m": 3000,
  "points": 25,
  "points_ranked": 20,
  "average_rank": 35.95,
  "average_total_rank": 40.96,
  "top3_points": 0,
  "top10_points": 1,
  "top20_points": 5,
  "share_of_top3": 0.0,
  "rating": 4.4,
  "review_count": 396,
  "top3_average_reviews": 231.3,
  "rank_matrix": [
    [
      46,
      56,
      null,
      null,
      null
    ],
    [
      33,
      17,
      38,
      49,
      null
    ],
    [
      24,
      14,
      6,
      39,
      59
    ],
    [
      24,
      12,
      13,
      22,
      51
    ],
    [
      54,
      50,
      54,
      58,
      null
    ]
  ],
  "source_url": "https://www.google.com/maps/search/?api=1&query=Blue%20Bottle%20Coffee&query_place_id=ChIJLRIbILeAj4ARyWoMWFQmkSY"
}| Field | Example value | Meaning |
|---|---|---|
row_type | summary | point (one grid point, charged), summary or competitor (free) |
business | Blue Bottle Coffee | The tracked business as Google Maps names it (empty in market mode) |
business_place_id | ChIJLRIbILeAj4ARyWoMWFQmkSY | Google’s place ID for the tracked business |
keyword | coffee shop | The search typed at each point |
grid_row | — | Point rows: 0 is the northernmost row |
grid_col | — | Point rows: 0 is the westernmost column |
latitude | — | Point rows: the grid point’s latitude |
longitude | — | Point rows: the grid point’s longitude |
rank_matrix on the summary row is the one people came for: the business’s rank at every point,
north row first, west column first, with null where it was not in the top 60. The centre of the
matrix is the business’s own location; in the sample row above, Blue Bottle ranked 6th there.
Two averages sit beside it, and they answer different questions. average_rank counts only the
points where the business ranked: 35.95 over 20 points here. average_total_rank counts every point
and scores an unranked one as the deepest rank plus one (61 at the default depth), which gives 40.96.
Use the second when you compare runs, because a business that drops out of the top 60 at a point
makes the first number look better, not worse. The heatmap is not a dataset row: it is an HTML page
per business and keyword in the run’s key-value store, named heatmap-<business>-<keyword>.
Step 5 — Export it
Open the Dataset tab and export to CSV, JSON, or Excel — or pull the same rows from the API, which is what you want if this is going to run on a schedule.
What it costs
$0.012 per grid point per keyword, with every page down to rank 60 included. A 5x5 grid for one
keyword is 25 points, $0.30; a 7x7 grid is 49 points, $0.59. Summary, competitor and notice rows
are free, and so is a point Google refused. A monthly report on 3 keywords at 7x7 is 147 points,
about $1.76. Apify Proxy comes on top as platform usage on your plan. Set Maximum grid points for
the run (maxGridPoints) to cap the spend across all businesses and keywords.
Where the data comes from
This reads Google Maps directly. The target is The same Google Maps search endpoint as nail-salon-leads-scraper (portfolio_common.gmaps), one search per grid point with the viewport centred on the point, up to three pages (rank 60), deduplicated by place id. Every night a canary runs this actor against that live source and diffs the result against a frozen fixture — what “verified” means.
The ranks come from Google Maps itself, not from the map pack on Google’s web search results. Each point is searched with the map view centred there, the way the Google Maps site searches when you move the map; it is not a phone’s GPS location. Google’s answer also shifts a little with where the search comes from: the same grid read over two internet connections differed by 1 to 4 places at the same points in our test, so compare runs of this actor with each other, at the same zoom.
See it used
Google Maps rank grid: coffee shop around a café in Oakland reads one 25-point grid row by row and names the 3 rivals that beat the café.
If what you need is the list of businesses in an area rather than their ranks, for example every café and bar in a city with its phone number, the Restaurant, Cafe & Bar Scraper reads the same Google Maps listings.
Last updated 2026-11-06